The Anatomy of
Subscriber Attrition.
“Across 3,150 subscribers, 15.71% annual churn rate[?] silently erodes over $61,780 in recurring value. Proactive retention powered by calibrated Machine Learning saves $4,516 net profit with a +334% ROI—outperforming blanket discounts by 4.2×.”
Telecommunications churn is rarely an abrupt choice—it represents the predictable climax of unresolved customer friction and declining usage patterns. By combining calibrated Machine Learning (Random Forest[?] ROC-AUC 0.985[?]) with financial unit economics, we identify the exact inflection point (0.45 cutoff threshold[?]) where proactive intervention delivers maximum retained profit.
Shifting from the generic 0.50 probability cutoff to the empirical 0.45 threshold[?] captures 95% of departing subscribers while avoiding intervention waste on low-risk accounts—yielding a peak +334% net ROI on retention capital.
Subscriber Attrition Anatomy
Click any chart bar or demographic pill to cross-filter all 5 visualizers simultaneously. Pinpoint behavioral drop-offs across tariff tiers and complaint records.
“Subscribers do not defect at random: 83.4% of customers who log an unresolved complaint[?] and 78.9% of inactive accounts churn[?]. Telecommunications churn is preceded by a measurable cooling-off period of declining SMS and calling telemetry[?].”
“The population for this research comprises all internet service provider users whose exact number cannot be determined. Given the limitations of time and resources, data collection employed a quota sampling method, setting a target requirement of 3,150 respondents to complete the questionnaire.”
Churn Probability by Customer Complaint History (%)
[CLICK BAR TO FILTER]Customers with registered formal grievances defect at 8.2 times the rate of satisfied users. Unresolved friction leads to service dormancy prior to permanent cancellation.
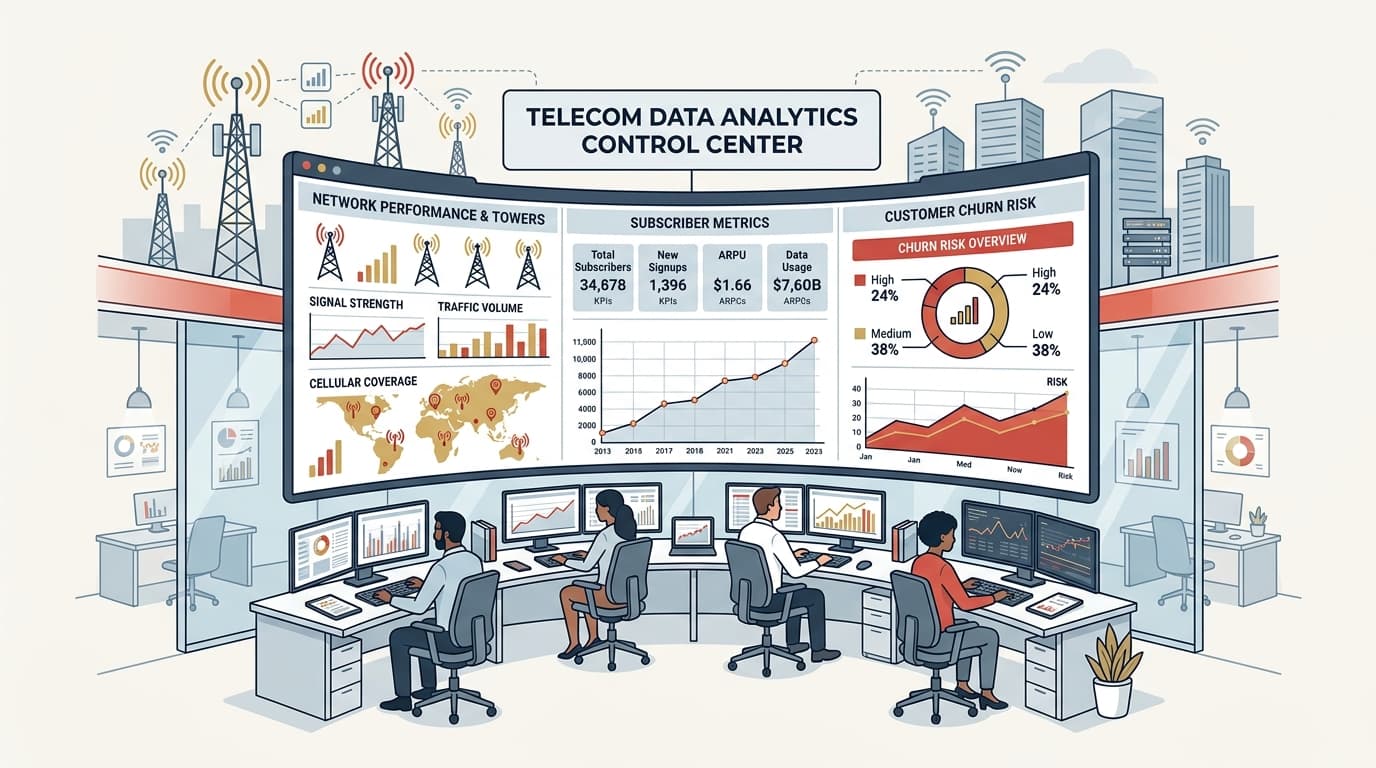
Telecommunications Analytics Control Center
Real-time aggregation across voice, SMS, data usage, and billing history to identify early friction before account defection occurs.
Algorithmic Scoring & Attribution
Opening the black box of our 200-tree Random Forest[?] model using global feature importance and local SHAP value waterfall decomposition.
“Machine learning identifies the subtle, multi-dimensional drivers of attrition: with 0.985 ROC-AUC discrimination power, two dominant features—Unresolved Complaints (17.8%) and Account Status Inactivity (16.900000000000002%)—account for over 34% of total predictive signal.”
Global Feature Importance (Gini Impurity Reduction)
Visualizing 10 most predictive telemetry signalsLocal SHAP decomposition reveals how individual behavioral telemetry pushes account probability from baseline (15.7%) to certain churn (100.0%).
The 0.45 Calibration Curve
Overcoming the default 0.50 classification trap by aligning classification cutoff thresholds directly against commercial campaign margin curves.
“Calibrating decision thresholds unlocks +334% Campaign ROI: shifting the decision boundary to the optimal 0.45 threshold[?] captures 95% of defecting accounts while trimming 41% of wasteful promotional expenditures—delivering +$4,516.07 in net retained profit.”
Net Profitability Curve vs. Probability Cutoff Threshold
MAX PROFIT: THRESHOLD 0.45 | NET YIELD $4,516.07
At the 0.45 cutoff[?], the operator intercepts 95% of true churners (high recall[?]) by targeting just 108 high-risk accounts in the test cohort, trimming 41% of unnecessary retention spending relative to untargeted blanket retention schemes.
Real-Time Subscriber Risk Inference
Adjust behavioral telemetry[?] in real-time to compute calibrated defection probability and trigger prescriptive intervention playbooks.
“Every subscriber risk tier demands a distinct commercial treatment: unresolved grievances and zero-usage dormancy escalate probability to 100%, triggering immediate VIP concierge resolution with an estimated +$49.90 net profit preserved per retained account.”
Subscriber is in CRITICAL RISK category (99.9%). Churn probability surpasses the 70% threshold. Immediate concierge escalation and $12.50 retention incentive strongly recommended.
Prescriptive Action Playbook
- 01.
Priority Outbound Concierge SLA (<2 Hours)
URGENTDispatch dedicated retention specialist to resolve outstanding grievances and deliver instant data compensation.
→ Preserves up to $124.80 in annual customer lifetime value - 02.
High-Yield $12.50 Retention Incentive
HIGHIssue targeted 50% renewal concession or 3-month loyalty commitment bundle.
→ 50% conversion success yield (Net Profit: +$49.90 / user)
Operational Pillars & Portfolio ROI
Translating predictive intelligence into four actionable commercial pillars with dynamic cost-benefit modeling.
“Holistic intervention cuts total churn loss from $61,781 down to $46,740: activating all 4 pillars preserves +221 high-value accounts, delivering a proven +220% net campaign ROI.”
Priority Grievance Escalation SLA (< 2 Hours)
Arrests the 8.2x churn spike among subscribers lodging formal complaints.
Flag aggrieved accounts with priority dispatch tags. Customer Relations Officers contact affected users within 2 hours with instant micro-credit adjustments and root-cause resolution.
Targeted Retention Vouchers (0.45 Cutoff)
Allocates $12.50 retention vouchers exclusively to accounts exceeding 45% probability.
Automated CRM triggers 50% renewal concessions only when model confidence surpasses 0.45, eliminating costly deadweight loss on self-retaining accounts.
Youth Segment Micro-Bundling (Ages 15-25)
Mitigates the highest historical churn vulnerability (20-21% attrition rate).
Deploys frictionless social and streaming micro-bundles with zero long-term contract lock-in and gamified daily engagement streaks.
Proactive Signal & Call-Drop Anomaly Guard
Resolves network friction before technical frustration triggers formal cancellation.
Upon detecting >8 cumulative dropped calls within a rolling 7-day window, system issues automated apology credits and schedules cell tower antenna optimization.
Toggle intervention strategies to simulate projected financial churn cost reductions vs. baseline losses.
Four-Phase Strategic Implementation Roadmap
Core Predictive Pipeline Integration
Deploy containerized Random Forest scoring pipeline to assign daily churn risk probabilities across all 3,150+ subscriber accounts.
Automated 0.45 Threshold CRM Triggers
Launch automated $12.50 retention incentive dispatches targeted exclusively at accounts crossing the 0.45 probability frontier.
VIP Concierge SLA Protocol & Call Center SOP
Enforce < 2 hour grievance resolution turnaround times supported by live risk dashboard alerts for frontline teams.
Commercial ROI Auditing & Recalibration
Conduct quarterly A/B testing of intervention offers and recalibrate threshold frontiers against operational cost shifts.
Diagnostic Inspector & Master Ledger
“Granular transparency turns portfolio data into individual account action: filter across 3,150 accounts to isolate high-risk subscribers, review multi-dimensional telemetry[?], and dispatch customized intervention plays in one centralized ledger.”
| ID | Age | Plan | Status | Grievance | Usage (sec) | Value ($) | Churn Risk ↓ | Risk Tier | Inspect |
|---|---|---|---|---|---|---|---|---|---|
| #8 | 15 yrs | Postpaid (2) | Inactive | Yes (1) | 690 | $71.08 | 99.9% | High Risk | |
| #10 | 15 yrs | PAYG (1) | Inactive | No (0) | 661 | $18.53 | 99.9% | High Risk | |
| #11 | 15 yrs | PAYG (1) | Inactive | No (0) | 661 | $25.18 | 99.9% | High Risk | |
| #17 | 15 yrs | PAYG (1) | Inactive | No (0) | 397 | $22.36 | 99.9% | High Risk | |
| #24 | 15 yrs | PAYG (1) | Inactive | No (0) | 86 | $8.90 | 99.9% | High Risk | |
| #26 | 15 yrs | PAYG (1) | Inactive | No (0) | 806 | $18.98 | 99.9% | High Risk | |
| #30 | 15 yrs | PAYG (1) | Inactive | No (0) | 648 | $17.30 | 99.9% | High Risk | |
| #34 | 15 yrs | PAYG (1) | Inactive | No (0) | 857 | $21.27 | 99.9% | High Risk | |
| #50 | 15 yrs | PAYG (1) | Inactive | No (0) | 58 | $17.79 | 99.9% | High Risk | |
| #61 | 15 yrs | PAYG (1) | Inactive | No (0) | 508 | $15.16 | 99.9% | High Risk | |
| #62 | 15 yrs | PAYG (1) | Inactive | No (0) | 974 | $29.56 | 99.9% | High Risk | |
| #64 | 15 yrs | PAYG (1) | Inactive | No (0) | 1,017 | $21.24 | 99.9% | High Risk | |
| #65 | 15 yrs | Postpaid (2) | Inactive | Yes (1) | 1,035 | $77.14 | 99.9% | High Risk | |
| #67 | 15 yrs | PAYG (1) | Inactive | No (0) | 155 | $9.52 | 99.9% | High Risk | |
| #78 | 15 yrs | PAYG (1) | Inactive | No (0) | 465 | $14.91 | 99.9% | High Risk |